
EXECUTIVE SUMMARY
A study (Protocol # IS210-TI-006) was carried out to compare the impact, if any, of EO concentration on product EO residual levels determined in accordance with ISO10993-7. Product samples were provided by a major medical device manufacturer for evaluation in the study. Samples of three device types were exposed two cycles with identical parameters with the only exception being one had a calculated EO concentration of 600mg/l and the other was 300mg/l.
Samples were retrieved immediately after the sterilizer primary aeration phase and stored appropriately in frozen conditions to prevent any further aeration while awaiting EO residual testing. The samples were extracted in H2O for 24 hours at 37°C and tested for EO residuals. One of the devices contained multiple materials so each material in this product was tested separately.
INTRODUCTION
The purpose of this study is to investigate the impact of EO concentration during the EO exposure phase of a sterilization cycle on the EO residuals remaining on the product on completion of the cycle.
| ISO11135:2014 | Sterilization of health-care products — Ethylene oxide — Requirements for the development, validation and routine control of a sterilization process for medical devices |
|---|---|
| ISO10993-7:2008 | Biological evaluation of medical devices – Part 7: Ethylene oxide sterilization residuals |
| IS210 -TI-006 | Trial Cycle Instruction – Phase 1: EO Residuals by EO Concentration |
MATERIALS & METHODS
Two EO cycles were performed as per Table 1, using the same dunnage load to minimize processing variables. The dunnage load included six pallets of bulk-packed disposable polypropylene syringes and two pallets of PVC tubing devices to fill an eight-pallet sterilization chamber. The load was allowed to aerate for 3 days at 30°C +/- 5°C between cycles to eliminate the carry-over of residues from one run to the next.
Samples of medical devices were provided by a leading device manufacturer for placement on each cycle and subsequent testing for residuals. The samples of each device were placed in triplicate in each cycle. They were placed in the same carton on top of pallet one of the dunnage load (PP syringes). The test samples comprise
- Device 1: Suction device comprising of rigid PVC
- Device 2: Auxiliary tubing comprising of soft PVC
- Device 3: Enteral feeding set comprising of PVC tubing, polypropylene spike connector and PVC welded bag
On completion of primary aeration, the load was removed from the process and samples retrieved from the load. The samples were frozen to approximately -18°C within 30 mins of cycle completion to halt further aeration pending testing.
DISCLAIMER
Please note, this was a very limited study involving a select number of polymeric materials and a single EO process with varying EO concentrations. Further investigative work is required to arrive at a generic conclusion that may be applied to medical devices in general.
| STAGE | PHASE | PARAMETER | SET POINT AT 300 mg/l | SET POINT AT 600 mg/l |
|---|---|---|---|---|
| Pre-Conditioning | Cell | Temperature | 50 °C | 50 °C |
| Relative Humidity | 60% | 60% | ||
| Dwell Time | 8 hours | 8 hours | ||
| Cell to Chamber | Transfer Time | N/A | N/A | |
| Exposure | Vacuum | Evacuate to: | 100 mbar | 100 mbar |
| Time | N/A | N/A | ||
| Chamber Temperature Outside Initial Vacuum and EO Dwell | 50 oC | 50 oC | ||
| Leak Test | Pressure Increment | 0 mbar | 0 mbar | |
| Stabilization Time | 1 min | 1 min | ||
| Dwell Time | 7 min | 7 min | ||
| N2 Flush | Pressure | 600 mbar | 600 mbar | |
| Time | N/A | N/A | ||
| Re-evacuation | Evacuate to: | 100 mbar | 100 mbar | |
| Time | N/A | N/A | ||
| Conditioning | Repeats | 4 | 4 | |
| Steam Injection | Pressure | 140 mbar | 140 mbar | |
| Time | N/A | N/A | ||
| Dwell Time | 12 min | 12 min | ||
| Vacuum | Evacuate to: | 110 mbar | 110 mbar | |
| Time | N/A | N/A | ||
| EO Gas Injection | Pressure | 293 mbar | 476 mbar | |
| Time | N/A | N/A | ||
| Gas Supply Temperature | N/A | N/A | ||
| Chamber Temperature | 50 °C | 50 °C | ||
| EO Gas Dwell | Chamber Temperature | 50 °C | 50 °C | |
| Dwell Time | 180 min | 180 min | ||
| 1st Post-Exposure Vacuum | Pressure | 100 mbar | 100 mbar | |
| Time | N/A | N/A | ||
| Steam / Nitrogen Washes | Repeats | 10 | 10 | |
| Steam Injection | Pressure | 125 mbar | 125 mbar | |
| Time | N/A | N/A | ||
| Nitrogen Injection | Pressure | 200 mbar A | 200 mbar A | |
| Time | N/A | N/A | ||
| Vacuum | Pressure | 100 mbar A | 100 mbar A | |
| Time | N/A | N/A | ||
| Air Washes | Repeats | 2 | 2 | |
| Air Injection | Pressure | 600 mbar A | 600 mbar A | |
| Time | N/A | N/A | ||
| Vacuum | Pressure | 100 mbar A | 100 mbar A | |
| Time | N/A | N/A | ||
| Final Air Admission | Pressure | Atmospheric | Atmospheric | |
| Time | N/A | N/A | ||
| Chamber to Cell | Transfer Time | N/A | N/A | |
| Degassing | Primary Cell | Temperature | 50 oC | 50 oC |
| Time | 8 hours | 8 hours |
Residuals testing was performed using cut up and immersion extraction into water at 37°C for 24 hours in accordance with ISO10993-7.
Device 1: Entire product
Device 2: A 30cm sample was taken from the middle of the tube for testing as a representative sample portion
Device 3a: A 30cm sample was taken from the middle of the tube for testing as a representative sample portion
Device 3b: The entire bag
Device 3c: The entire spike
Testing was performed using Gas Chromatography validated for testing of EO residuals in accordance with ISO10993-7. Detection was via an FID detector at 300°C. The concentration of EO and ethylene chlorohydrin (ECH) were calculated from the resultant data generated.
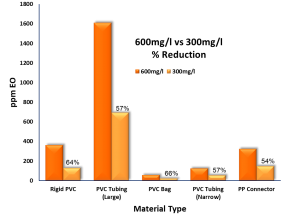
RESULTS: COMPARISON OF EO RESIDUAL OUTCOMES
The following tables summarize the results of the different levels of EO concentration on the product EO residual outcomes.
| Device 1 – Rigid PVC Yankauer | |||||
|---|---|---|---|---|---|
| 600mg/l cycle | 300 mg/l cycle | ||||
| EO (ppm) | EO (mg/device) | EO (ppm) | EO (mg/device) | % Reduction | |
| 358.81 | 3.62 | 123.72 | 1.25 | ||
| 360.02 | 3.64 | 126.80 | 1.28 | ||
| 364.98 | 3.72 | 134.89 | 1.35 | ||
| 361.27 | 3.66 | 128.47 | 1.29 | 64% | |
| Device 2 – Soft PVC Auxiliary Tubing | |||||
| 600mg/l cycle | 300 mg/l cycle | ||||
|---|---|---|---|---|---|
| Sample | EO (ppm) | EO (mg/device) | EO (ppm) | EO (mg/device) | % Reduction |
| 1 | 1555.01 | 30.98 | 632.77 | 12.67 | |
| 2 | 1379.84 | 26.87 | 636.09 | 12.67 | |
| 3 | 1893.07 | 37.10 | 798.62 | 16.38 | |
| Average | 1609.31 | 31.65 | 689.16 | 13.91 | 57% |
| Device 3a – PVC Bag | |||||||
| 600mg/l cycle | 300 mg/l cycle | ||||||
|---|---|---|---|---|---|---|---|
| EO (ppm) | EO (mg/device) | EO (ppm) | EO (mg/device) | % Reduction | |||
| 62.21 | 1.44 | 19.96 | 0.46 | ||||
| 61.53 | 1.38 | 19.95 | 0.46 | ||||
| 48.69 | 1.11 | 18.72 | 0.43 | ||||
| 57.48 | 1.31 | 19.54 | 0.45 | 66% | |||
| Device 3b – PVC Tubing | |||||||
| 600mg/l cycle | 300 mg/l cycle | ||||||
|---|---|---|---|---|---|---|---|
| EO (ppm) | EO (mg/device) | EO (ppm) | EO (mg/device) | % Reduction | |||
| 215.60 | 0.47 | 69.37 | 0.16 | ||||
| 78.88 | 0.18 | 40.12 | 0.09 | ||||
| 82.81 | 0.18 | 51.15 | 0.12 | ||||
| 125.76 | 0.28 | 53.55 | 0.12 | 57% | |||
| Device 3c – PP Spike Connector | |||||||
| 600mg/l cycle | 300 mg/l cycle | ||||||
|---|---|---|---|---|---|---|---|
| EO (ppm) | EO (mg/device) | EO (ppm) | EO (mg/device) | % Reduction | |||
| 336.73 | 0.62 | 159.50 | 0.29 | ||||
| 332.78 | 0.61 | 138.25 | 0.25 | ||||
| 300.99 | 0.55 | 144.63 | 0.26 | ||||
| 323.50 | 0.59 | 147.46 | 0.27 | 54% | |||
DISCUSSION
From the results of this limited study, it can be seen that a 50% reduction in EO concentration resulted in an associated reduction in EO residual levels on the materials used in the products tested within the study. In the case of PVC, both rigid and soft grades, the resulting reduction in product residuals was greater than 50%.
It can be concluded from this study that reducing EO concentration in an EO cycle will result in lower residuals on product, which in turn could result in shorter aeration times to meet the limits set out in ISO10993-7: 2008
Authors:
Keith Beaumont, Validation Manager (BSc)
Brian McEvoy, Senior Director, Global Technologies (MBA, BSc)
Richard Cowman, Technical Director-Global EO, (BA, Dip. Applied Biology)
Related TechTips
Ethylene Oxide Master File Pilot Program FAQ
Q: What is the Ethylene Oxide (EO) Sterilization Master File Pilot Program? A: In an effort to advance innovation in medical device sterilization with ethylene oxide (EO) and reduce the threat of shortages of EO-sterilized medical devices by providing
Sustainable EO® Frequently Asked Questions
As part of our commitment to providing innovative and sustainable solutions, STERIS AST has developed the Sustainable EO® sterilization services program.
Overview Of Sterilization Technology Comparison
Learn more about our global offering, which includes electron beam, gamma, X-ray, and ethylene oxide technologies
Selection of Appropriate Internal Process Challenge Devices (PCDs)
This TechTip provides a summary of minimizing over-processing by understanding how to establish an appropriate internal process challenge device. Let our team review your process and identify other ways to help reduce EO sterilant used through our Sustainable EO® sterilization services